In Task 53, turn the supplied data into a short, coherent Korean text. First state the frame of the material, then the main pattern and the data that prove it, adding only causes or forecasts that actually appear in the prompt.
1. What TOPIK II Task 53 is
Task 53 is the third of four Writing tasks in TOPIK II PBT. The entire writing section is allotted 50 minutes; there is no separate official time limit for Task 53 alone.
Task 53 parameters
- Format
- TOPIK II PBT
- Length
- 200–300 characters
- Title
- Do not write one
- Maximum
- 30 points
The task does not test free reflection, but work with a source: understand the topic, period, groups, and units; select data; and connect it into formal prose. See the TOPIK II overview for the full map of Tasks 51–54.
2. What kinds of data can appear
Task 53 is often called ‘graph description’, but the format is broader. The guide uses the terms 도표 and 도식, and analysis of published tasks shows numerical, comparative, and non-numerical structures.
Material type
Line graph
Material type
Bar chart
Material type
Table
Material type
Survey results
Material type
Multiple series
Material type
Non-numerical diagram
Material type
Cause or forecast
3. How to write Task 53: a step-by-step method
- 01
Read the instructions
Mark exactly what must be covered: comparison, change, cause, classification, or forecast.
- 02
Fix the frame
Write down the topic, period, participants, units of measurement, and research source if it is named.
- 03
Find the relationships
Identify the overall trend, most important difference, similarity, maximum, minimum, or changing gap.
- 04
Choose evidence
Keep the numbers and labels that support the conclusion, but do not omit a required block of the prompt.
- 05
Assemble a plan
Frame → main pattern → key data → the ending required by the material.
- 06
Write in one register
A safe learning strategy is the formal written -다/-ㄴ다/-는다 style.
- 07
Compare with the prompt
Find the basis in the image for every number, cause, conclusion, and forecast.
The official guide requires an appropriate written register and warns against conversational expressions as well as -ㅂ/습니다 and -아/어요 endings. Do not turn the response into a list of points.
4. How to describe graphs, tables, and charts
Technique
Name the material first
help establish the topic. Do not say that ‘the graph grew’: it is the indicator, number, or share that changes.
Technique
Choose numbers by function
Compare like units and groups.
Technique
Distinguish percentages from percentage points
Unambiguously: 1인 가구의 비율은 15%에서 30%로 늘었다. For the difference in shares: 15%p 높아졌다.
Technique
Do not invent causation
Use -기 때문이다 and -(으)ㄹ 것으로 전망된다 only when the cause or forecast appears in the material.
5. Grammar and vocabulary for Task 53
| Function | Korean expressions | When to use |
|---|---|---|
| Introduce the material | 이 자료는 …을 보여 준다 · 조사 결과에 따르면 | State the topic, subject, or source |
| Increase | 증가하다 · 늘어나다 · …배가 되다 | The indicator has genuinely become larger |
| Decrease | 감소하다 · 줄어들다 · 낮아지다 | The indicator has become smaller |
| Scale | 소폭 · 큰 폭으로 · 크게 | The degree is supported by the figures |
| Comparison | 보다 · 에 비해 · 반면에 | Like indicators are compared |
| Close values | 비슷한 수준이다 · 차이가 거의 없다 | The difference is genuinely small |
| Share | 전체의 X%를 차지하다 · 비율 | A part of a whole is described |
| Maximum and minimum | 가장 높다 · 가장 낮다 · 1위를 차지하다 | There are several comparable categories |
| Survey | 응답자의 X%가 …라고 답했다 | The material reports respondents’ answers |
| Cause | -기 때문이다 · -로 인해 | A cause is given or explicitly requested |
| Cautious conclusion | … 것으로 보인다 | The conclusion is directly grounded in the data |
| Forecast | …-(으)ㄹ 것으로 전망된다 | The material includes a forecast |
Do not aim to display the maximum amount of complex grammar. The rubric rewards range and accuracy, so a simple suitable construction is better than a complex sentence that distorts the data.
6. A template builder
These are not ready-made texts to memorize, but four logical routes. Choose the route according to the relationships in the specific prompt.
Route
One trend
Route
Two groups
Route
Change with an explanation
Route
Two connected materials
7. Task 53 example: from chart to finished answer
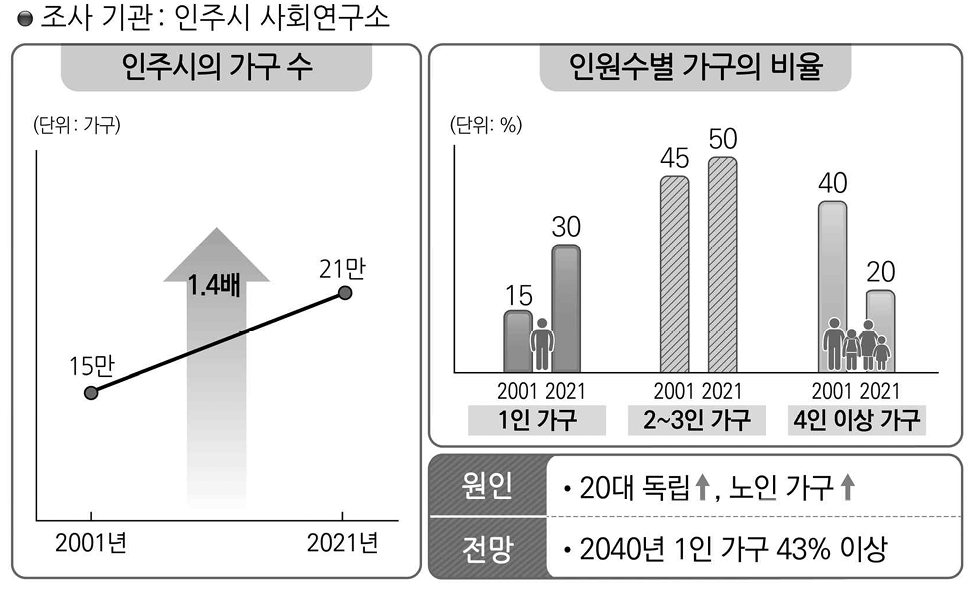
The prompt from the 83rd test asks you to describe changes in the number and composition of households in Inju City, including the stated causes and forecast.
What to notice
- The total number of households rose from 150,000 to 210,000—a 1.4-fold increase.
- The share of one-person households rose from 15% to 30%, and that of 2–3-person households from 45% to 50%.
- The share of households with four or more people fell from 40% to 20%.
- The causes are already given: growing independence among people in their twenties and a rise in elderly households.
- The forecast 43% 이상 means ‘43% or more’, not exactly 43%.
Answer plan
- Source and topic.
- Overall increase.
- Changes in the three groups.
- Causes.
- Forecast.
Finished answer
Answer based on the material
An internal technical count places this answer in the 200–300-character range, but it is not an official exam counting algorithm.
Translation
The Inju City Social Research Institute studied the change in the number of households in Inju City. Their total rose 1.4-fold, from 150,000 in 2001 to 210,000 in 2021. The share of one-person households increased substantially from 15% to 30%, while that of 2–3-person households rose slightly from 45% to 50%. In contrast, the share of households with four or more people halved from 40% to 20%. The reasons are growing independence among people in their twenties and a rise in elderly households. According to the forecast, one-person households will account for at least 43% in 2040.
| Error | Why it is an error |
|---|---|
| 1.4% 증가했다 | A multiplier is mistakenly turned into a percentage. |
| 1인 가구가 15% 증가했다 | A percentage and a percentage point are confused. |
| 출산율이 낮아졌기 때문이다 | An absent cause is invented. |
| 2040년에는 43%가 될 것이다 | The lower bound and forecast status are lost. |
After this walkthrough, it is useful to test the same approach with a different set of data: open Task 53 practice in TopikLab, create your own outline first, then write your answer and compare the learning-focused explanation with the criteria above.
8. Criteria and common errors
| Criterion | Points | Final check | Red flag |
|---|---|---|---|
| Content and task completion | 7 | All requirements are covered; numbers, years, groups, and directions are accurate. | A block is omitted, a number is confused, or a cause is invented. |
| Organization | 7 | The main pattern is clear; data are grouped; links express real relationships. | The answer becomes a random list of numbers. |
| Language use | 16 | The written register is consistent; grammar, particles, vocabulary, and spelling are accurate. | Registers are mixed or a complex construction distorts meaning. |
Five errors with a high risk of lowering the score
- Omitting one of the required blocks of the material.
- Confusing a quantity, share, percentage point, multiplier, or rank.
- Inventing a cause, forecast, or recommendation.
- Listing figures without showing the relationships between them.
- Using a conversational or inconsistent register.
9. Frequently asked questions
What can appear in Task 53: a graph, table, or diagram?
Different kinds of provided information are possible. The official guide refers to 도표 and 도식, and published materials include charts, tables, surveys, multiple series, and non-numerical diagrams.
Do I always have to describe a graph?
No. You must write a text based on the provided information. In a classification diagram, explain the categories and features rather than inventing growth or percentages.
Do I need to include every number?
There is no separate rule requiring you to copy every figure. Cover all required meaning blocks and choose enough data for the trend, comparison, or conclusion.
How many paragraphs should I write?
There is no official fixed number. A clear beginning, development, and ending are required; one compact paragraph is acceptable if the logic is easy to follow.
Can I use a ready-made template?
You can automate the frame and language functions, but not one universal text. A framework containing cause or forecast becomes an error if they are absent from the prompt.
Can I add my own opinion?
Only if the prompt requires it or the conclusion is directly supported by the material. An arbitrary personal evaluation is unnecessary for an ordinary source-based task.
What grammar do I need?
First of all, neutral reporting, change, comparison, share, ranking, and survey responses. The complexity of a construction matters less than its accuracy.
How much time should I leave?
Officially, 50 minutes are allotted for all four PBT Writing tasks. A practical target for Task 53 is 10–12 minutes, but this is not an exam rule.
How do I count 200–300 characters?
The official prompt specifies a range in 자, but the guide found does not provide a universal official digital counting algorithm. Check the current answer sheet and session instructions.
How does Task 53 differ from Task 54?
Task 53 is a 200–300-character text based on provided information, worth 30 points. Task 54 is a 600–700-character thematic essay worth 50 points.